This week’s dry bulk market insights offer a snapshot of the latest developments, covering key trends, market sentiment, fundamentals, rate movements and demand – supply dynamics shaping the sector.
Dry bulk volatility is no longer the exception but the baseline, marking a shift from cyclical swings to a constant new reality
In a paper published in February 2026, Lam, J.S.L., Li, Q. & Pu, S. highlighted a critical reality, while many commodity markets experience sharper short-term spikes, freight markets rank among the most volatile over a 30-year period. Within freight, the dry bulk sector stands out as the clear leader in volatility.
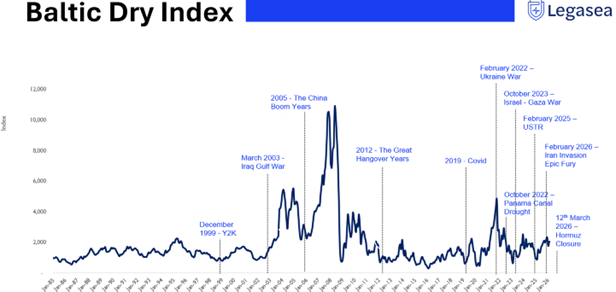
As the backbone for transporting the world’s most essential commodities, dry bulk increasingly acts as a leading indicator, a “canary in the coal mine”, for systemic disruption.
As shown in the chart, major commodity shocks historically occurred roughly once a decade. Since COVID, that pattern appears to have shifted dramatically, with disruptions emerging almost annually.
With the ongoing “open-again, closed-again” saga in the Strait of Hormuz creating significant disruption in commodity markets, it seems we are set to chart even higher levels of volatility in dry bulk freight, if that is even possible.
Freight Market Dynamics Hijacked by Brent Crude
Historically, daily movements in the Baltic Dry Index (BDI) have been a key driver of trends in commodities seaborne freight calculation. The index largely reflected seasonal and cyclical supply-demand fundamentals tied to core global commodities such as iron ore, coal, and grains, which typically followed relatively predictable patterns over monthly and annual cycles.
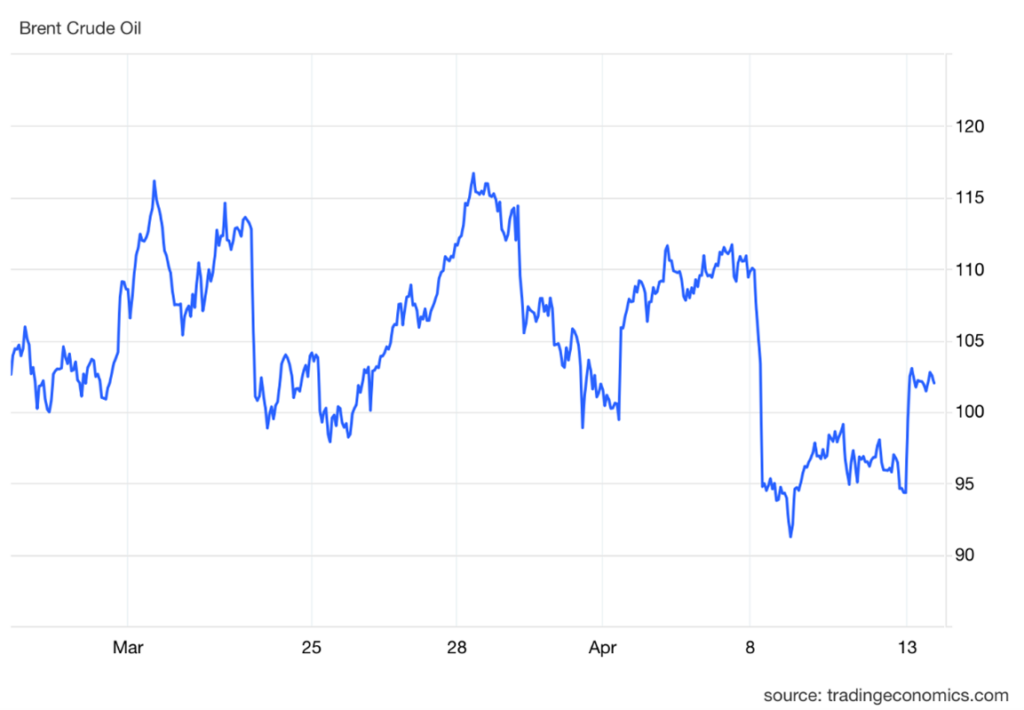
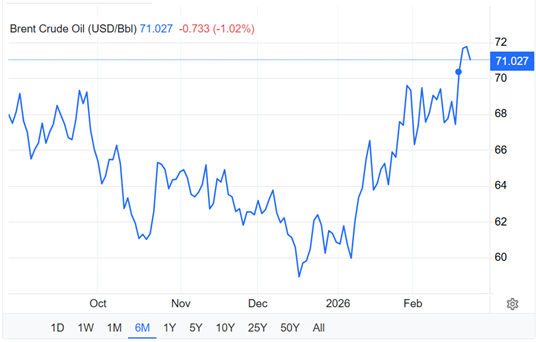
However, with vessel fuel costs now closely linked to Brent crude, the wild volatility of daily political machinations have replaced the once simpler daily calculation of seaborne freight rates.
A look at the sharp swings in oil prices since March highlights this shift clearly. Given that fuel now accounts for more than 50% of dry bulk freight cost calculations,
Oil Price Volatility Sends Shockwaves Through Commodity and Freight Markets
With fuel costs (bunker prices) representing up to 50% of the total freight cost for transporting commodities, recent fluctuations in oil prices are significantly impacting both commodity and freight markets.
Low-value bulk commodities, such as salt priced at around USD $50 per tonne, are particularly vulnerable to these swings. Recent volatility in Brent crude, driven by escalating geopolitical tensions in the Middle East, has affected the landed export value of some commodities by as much as 10%. While consumers may grumble over rising fuel prices at the pump, it is worth remembering that those managing bulk cargo face similar or even greater pressures. If tariffs or trade disputes weren’t keeping them awake, oil price volatility certainly is.
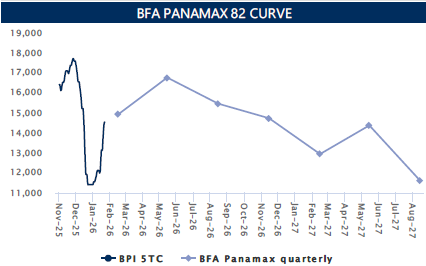
Panamax Dry Bulk: A Decade of Underperformance Meets a Promising 2026 Shift
The Panamax asset class of dry bulk vessels have underperformed every other asset class in dollar per deadweight tonnes for a decade.
*Chart courtesy Arrow Shipbrokers and Research
A post–global financial crisis building frenzy left the sector perpetually stuck in a supply–demand imbalance, weighing on sentiment ever since.
However 2026 signals a meaningful shift in the demand outlook, with early foundations arguably laid in Q4 2025, coinciding with the US soybean trade delegation deployed in support of American farmers.
If only there were a Nobel Prize for Panamax patience.
Capesize Market Starts 2026 on a High Note
This feat makes it the second strongest start to a year on record. More incredible is that the forward curve shows that Capes could spend a large part of the year earning close to $30,000 per day.
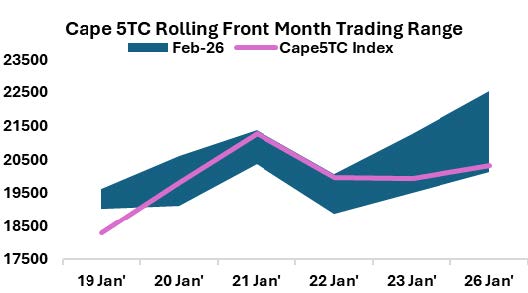
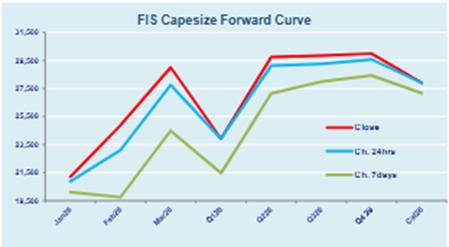
Charts courtesy Freight Investor Services Ltd (FIS)
This whilst being impressive outright is important to the rest of the dry bulk complex because the ratio of Cape versus Panamax on the forward crossing over 1.80 means that its almost certain the sub cape sector will be dragged up as cargo splitting occurs.
If the cure for high prices is high prices, it will be interesting to watch this ratio over the coming weeks.
Chinese Soybeans Import by Marketing Year
In a marketing year that runs September to August, this point of the year in early Quarter 1 and even Quarter 2 should be a benign time to see Beans volumes on dry bulk vessels.
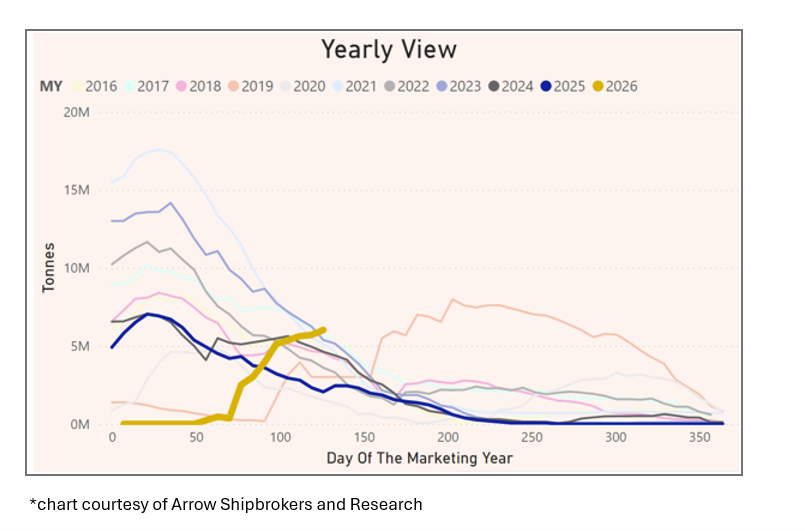
However in stark contrast to the normal cycle, China is busy fulfilling its commitment to buy US beans and this has delivered the Panamax dry bulk sector an explosive start to the year.
Once again politics Trumps the natural commodity flow cycles and we can probably expect that 2026 will continue to deliver many more volatile disruptions judging by the recent Davos assembly.
In the Year of the Horse – the Panamax Looks Set to be the Bolter
Whilst Supramax has been the stayer, having outperformed Panamax soundly since 2015, a hectic grains programme from the Atlantic to China has delivered Panamax earnings a fireworks start to the year.
In less than three weeks of trading so far this year, Panamax has seen a 40% run-up in values, leaving Supramax lagging in its wake after dropping almost 20%.
The question is – Can Panamax finally beat Supramax earnings for the year?